How far might broadband funding go? Estimating and visualizing the BEAD program
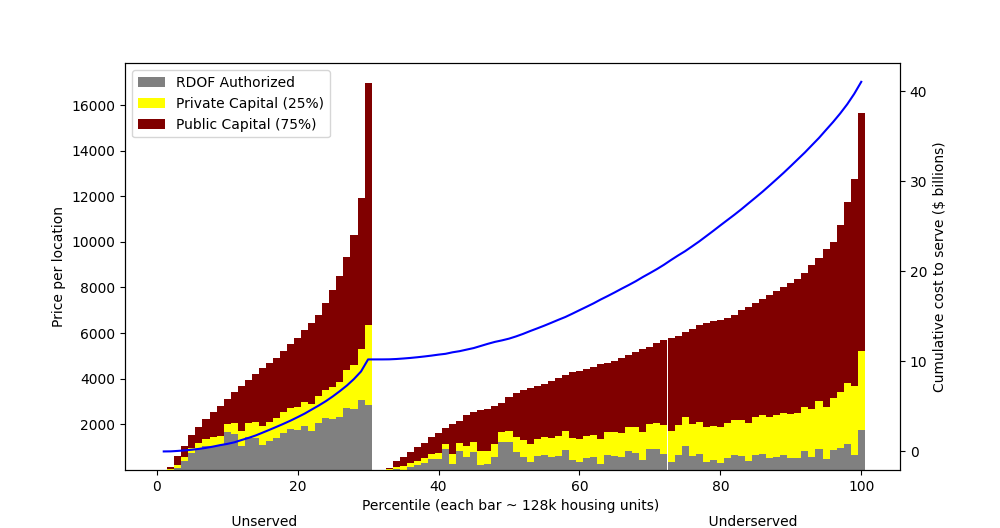
In the previous post, I created a model that provides “cost to serve” for any un- and under-served location in U.S.. Combined with data about the number of un- and underserved we can estimate how far broadband funding might go. Here’s what it looks like with the cost model and the current Form 477 data:
Here’s how to read this: from the left, we start by funding the least expensive unserved areas. As we move right, the unserved areas get more expensive, until eventually we’ve funded them all. Then we “reset” to start funding the least expensive underserved areas. Each vertical bar represents 1/100th of the total number of housing units that are un- and underserved. There are 12.8 million of those, so with each bar that we pass moving left-to-right we’ve served 128k housing units.
BEAD grants won’t be used to fund areas that have already been authorized by the FCC for RDOF funding, so we don’t need to worry about those. Those areas are in grey. Almost 30% of the housing units in unserved areas have already been authorized by RDOF. That’s why the grey section for unserved areas is sizable.
Of the remaining unserved areas, there’s an expectation that private (or at least non-BEAD) capital will serve as matching funds — the federal government hopes to not have to fund 100% of these projects. I’m assuming that private capital provides 25% of the remaining necessary funding. What’s left after RDOF and private capital is what BEAD would be used for and will spend down against the $42 billion.
The blue line (and right vertical axis) is the cumulative sum of the necessary public funds. In this example, we’ve funded all the unserved areas with just over $10 billion! How is that possible? A couple reasons:
We’re down to 3.8 million unserved housing units according to the latest Form 477 data and 2019 population projections, a mere 2.7% of housing units.
BEAD will need to fund all unserved eligible locations, not just unserved housing units.
As stated, almost 30% of these housing units have already been authorized by RDOF.
The reserve price from RDOF (after filling in gaps with a model) could underestimate how much it costs to serve a location. The new Wegman’s near my house wants $14 for a salad - inflation in telecom costs could be even higher.
The situation states will face in allocating their BEAD funding is much different from the chart above. Let’s try to make some assumptions about what it might look like with a more realistic cost model and estimates of how the new FCC maps might look.
In this version, all of the unserved are covered with about $24 billion. The $42 billion available in BEAD would cover about 65% of the existing un- and underserved. Still not too bad!
Here are some of the assumptions built into this second version:
Every location costs 15% more than the cost model, because, well, one way or another that will happen.
We assume there are double the number of un- and underserved locations. However many unserved housing units were in a census block, I just doubled it. Research suggests that a fair thing to expect from the new maps.
There are a couple additional assumptions I’d like to make in future versions:
States will be define some locations as “Extremely High Cost” and use lower-cost options, presumably LEO satellite in those areas. It would be interesting to make assumptions about where that cutoff would be and how many more under-served locations would then be funded.
The amount of private capital needed as matching funds likely decreases as the price per location increases. Put another way, a state might be willing to fund nearly 100% of a FTTH build in rural, hard terrain. Whereas for easier-to-serve areas the expectation of private capital match is likely much higher. I’d like to incorporate that.
I’m trying to be clear that I’m layering estimates and assumptions on top of each other and we should think of this as illustrative and not declarative in terms of how far the $42 billion will go. Still, what it says to me is that $42 billion is a lot of money and can go a long way.
Thanks to Jon Wilkins at Quadra Partners and a couple others for thoughtful comments on early drafts of this analysis.


What do you assume in this model about RDOF areas that the BEAD NOFO allows to be overbuilt (i.e., those covered by satellite)?