Hypothetical BEAD funding for states using current Form 477 data
And estimates of how the allocations can change post new maps
The IIJA gives NTIA a specific allocation formula for distributing the $42.45 billion in the Broadband Equity, Access, and Deployment (BEAD) Program. Importantly, even the allocation of funds to states has to wait until after the FCC is done with their new maps. After all, the formula is based on the number of unserved locations and we don’t trust the existing data on unserved locations.
In this post, I use the existing Form 477 data to do an initial allocation, then use parameters from existing research to make estimates about how the allocations might change under the new maps. Small changes in the number of unserved locations relative to other states can mean a big swing in funding. For example, Alabama goes from $1.9 billion in funding with current data to $1.3 billion with the estimates.
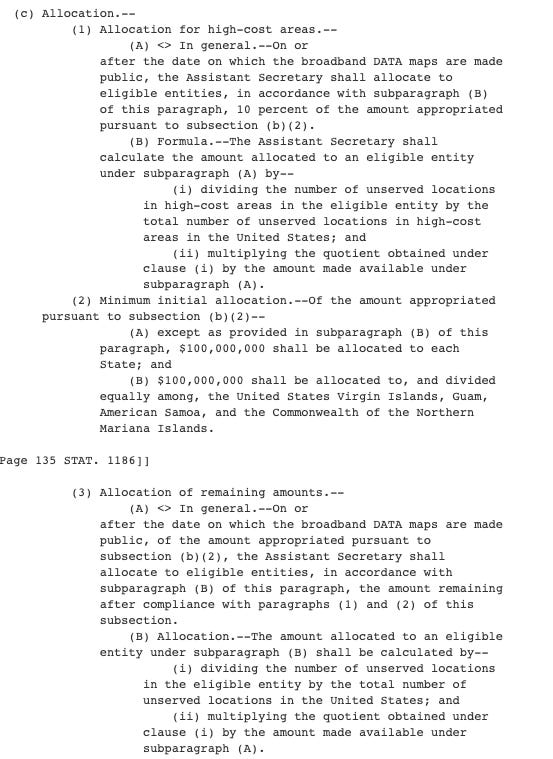
The allocation formula starts in the IIJA section 60102(c)(1)(A,B). My read of it is there is an initial “high-cost” allocation, then $100 million to every state, then the rest is distributed by the same “high-cost” formula. The “high-cost” formula uses the number of unserved locations in the state divided by all the unserved locations in the U.S. and multiples it by the amount of funding available. If every state had the same number of unserved locations, every state would get the same amount of money.
A note here that all the allocations are based on the number of unserved (25/3) locations. Nowhere does the allocation include the number of underserved (100/20) locations, even though those locations are eligible locations for deployment projects.
Another thing that’s important at this point: all of the allocations are done based on “unserved locations”. An unserved location is:
(A) Unserved location.--The term ``unserved location'' means a broadband-serviceable location, as determined in accordance with the broadband DATA maps, that--(i) has no access to broadband service; or (ii) lacks access to reliable broadband
service offered with--(I) a speed of not less than--(aa) 25 megabits per second for downloads; and (bb) 3 megabits per second for uploads; and (II) a latency sufficient to support
real-time, interactive applications.
In the new FCC maps, broadband-serviceable locations will include residential and commercial locations. I think most people think of the Homework Gap as unserved residential locations divided by total residential locations (or the same thing with population).
Using the current FCC data (as of Dec 2020), this is what the allocations would look like. The unserved housing units are from the FCC’s block level estimate file which has a vintage of 2019.
Obviously there is a lack of trust with the existing FCC maps, and they are working diligently on updating them. Of course we don’t know exactly what the new maps will show. The best we have is previous industry and academic research on it. One estimate, from George Ford, is that Form 477 overestimates coverage by 1.9 percentage points in urban areas and 11.5 percentage points in rural areas— 3.3 percentage points overall.
Here’s an example of how this estimate works: 17% of rural Alabama housing units are unserved according to FCC data. And 1.8% of urban locations are unserved. After adjustments, 29% of rural housing units and 3.7% of urban housing units are unserved. In New York state, 3% of rural and 0.4% of urban are unserved with current data; after adjustment it is 14% and 2%.
These adjustments produce a dramatic swing in funding towards bigger more urban states. Using current data, the ratio of rural:urban unserved housing units is 3.7:1. After adjustments, it has shrunk to 2.5:1. As mentioned, Alabama goes from $1.9 billion in funding to $1.3 billion. New York increase their share from $732 million to $1.5 billion.
This data need thorough peer review—here’s the spreadsheet. After all, it is estimates from research that was itself an extrapolation from a handful of states. However, I think it’s safe to say that given the small amount of unserved housing units nationally (2.7% of housing units are unserved), the changes to those numbers that will happen with the FCC’s new maps will lead to big changes in the funding allocation relative to what the existing maps would produce.


