

New National Broadband Map Update v5, Data as of June 2024

A few days ago, the FCC released the 5th version of the National Broadband Map, with data as of June 2024. At a high level, the trend continues of fewer and fewer unserved and underserved locations: in the previous version, 8.8 million locations were unserved or unserved. Now, with six months more data, we’re down to 7.5 million locations needing better broadband service. That’s an 15% decrease over one six-month period. And a 37% decrease from the first BDC broadband map 18 months ago.
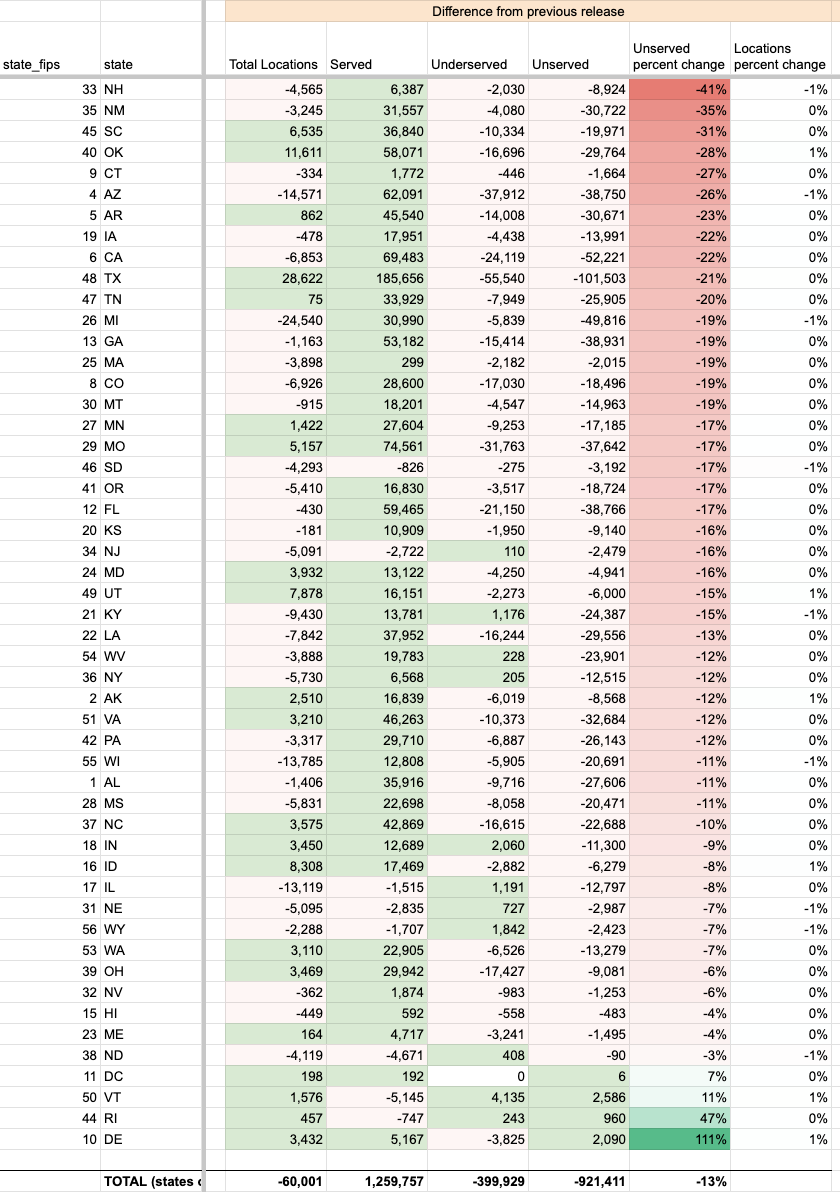
Here’s the spreadsheet.

Here’s another way to think about it: when NTIA made the formal allocation, there were 11.9 million unserved locations. That was $3,341 per location. On the basis of less eligible locations alone, since the available funding stays the same, now there’s $5,662 per location — a 69% increase. And that’s not counting the 3.5 million+ locations that will be served by RDOF or Enhanced ACAM and not even eligible for this funding.
Numerous states shed 20% or more of their unserved locations. South Carolina went from 116,296 underserved and unserved to 85,991 locations. That is a 26% decrease in the amount of unserved and underserved locations.
I always find it helpful to look at some random examples to understand what happened. In the first case, the previous version of the map showed this area in Victor, Montana as only served by DSL and two unlicensed fixed wireless providers. In the latest version Rocky Mountain Internet has added a “Licensed By Rule” filing at 250 Mbps download and 100 Mbps upload, which according to NTIA’s definition is quality broadband.

The second random example is almost exactly the same. A location (that doesn’t actually look like a real location) in Muldoon, Texas was covered by unlicensed fixed wireless from Resound Networks in the previous Broadband Map. Resound Networks added a licensed fixed wireless filing at 300/150.

I suspect there’s a lot going on behind the scenes with each of these updates. A few states have already finalized their lists of BEAD-eligible locations; in those cases, these updates will not change the BEAD-eligible status of the location. Also, normal buildout, including the RDOF program, is starting to show up on the map. I suspect there are hundreds of interesting stories embedded in each new version of the map. If you have ideas about what to look at, let me know in the comments.