

Solar curtailment in California is setting new records.

In the spring in California, high solar generation and low demand (not much air conditioning ) happen at the same time, almost every day in the middle of the day. I think California is a canary in the solar farm, and it’s critical to understand how they’re handling this new grid.

Above is a typical chart for CAISO so far this year. In the middle of the day, solar is curtailed (hence the bumpy renewables line). At the same time, gas is still being dispatched at a few gigawatts. And even though the grid had been importing power during the nighttime, it switched to exporting power when the sun came up.
I can think of three possible explanations for this chart:
Resource adequacy rules - maybe the grid operator is requiring gas to be online in case the sun goes down at any moment, and that explains the ~1-3 gigawatts of gas dispatch.
Transmission congestion - maybe the solar power being generated can’t reach the demand, and that demand needs to be met from other sources.
Export demand high enough, and prices low enough, that the grid is still a net exporter, even though some imports are being used to meet the demand that would have been otherwise met by curtailed solar.
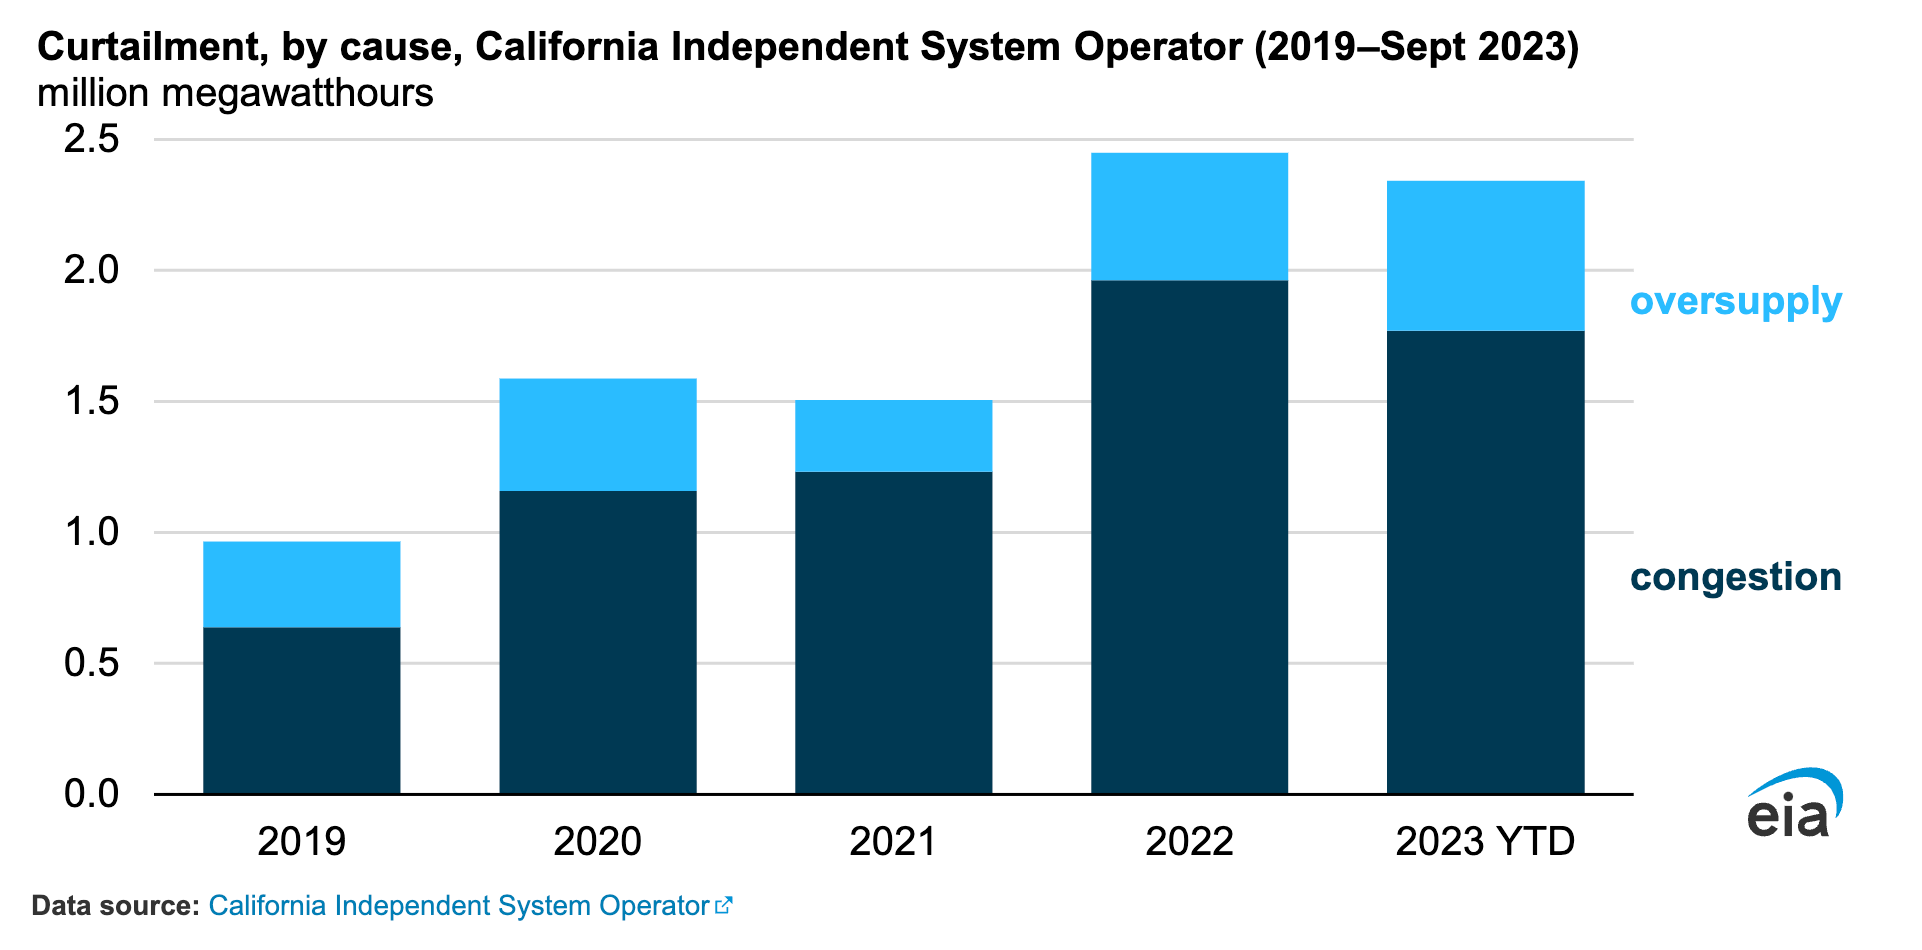
The second one — transmission congestion — I think is the largest contributor. Late last year, the Energy Information Agency did a great and concise look at this, noting that in the spring of 2023, solar curtailment peaked at nearly 700 GWh in a month. This curtailment is largely — almost exclusively — in the spring.

It’s also growing year over year. It 2019 they curtailed just under 1,000 GWh. By 2023, it was about 2,300 GWh. CAISO classifies curtailment into two categories: congestions and oversupply. Congestion is the biggest and more clear so let’s address that one first.
Here’s just the local congestion. It’s way worse this year.

According to CAISO’s definition, local “congestion occurs when available, least-cost energy cannot be delivered to some loads because transmission facilities do not have sufficient capacity to deliver the energy.”
CAISO doesn’t have a chart that show them together, but we can reconstruct it. The below chart shows the fuel mix for March 13, 2024. Renewables maxes out about 18 GW through the middle of the day. But in the middle of day, multiple GW of power was curtailed, peaking around 5 GWh curtailed around 3pm. The dotted green line represents what would have been dispatched if there had been no local transmission congestion.

The demand that solar was unable to meet was met some other way. But how? It doesn’t appear that CAISO switched on gas generators to meet the demand (at least not this year). Through the middle of the day, gas generation was only about 2 GW (and remember ~5 GW could have been served by solar). Since CAISO’s other forms of supply are not dispatchable — nuclear, and large hydro in particular — that suggests that the demand was met with imports from neighboring grids.
Before we dig more into imports and exports, let’s spend another moment on gas. While so far this year gas seems to peak about 2 GW, last year in May, gas supply did surge in the middle of the day, up to 6 GW at some periods.

It’s possible that we’ll see that again this year. As demand grows as warmer weather arrives, CAISO can get less power from neighboring grids and has to dispatch more gas. Or at least that’s a theory as to what could happen.
In future posts, I’d like to dig more into net exports (I think it’s possible some regions are importing even when the grid as a whole is exporting), and resource adequacy rules. It will also be fascinating to see if CAISO dispatches more gas later in the spring, or if that was a feature of the grid last year but not this year.