The effect of "maximum advertised speed" on coverage numbers
With $37 billion of the $42 billion BEAD program based on the number of locations unserved by broadband, accurately measuring who is unserved is critical — both for the allocation of funds but more importantly so people without access to real broadband can be connected. In this post, I’ll look at what happens if certain suspect service offering were counted as unserved. Overall, there are 2,043,676 locations that are unserved but for the presence of a fixed wireless or DSL service that claims to deliver 25 Mbps download and 3 Mbps upload on the number (max advertised speed = 25/3 exactly).
For the purposes of the BEAD program, a location is served (or underserved) if a provider offers service at a “maximum advertised speed” of 25 Mbps download and 3 Mbps upload from a wired connection or through wireless using licensed spectrum.
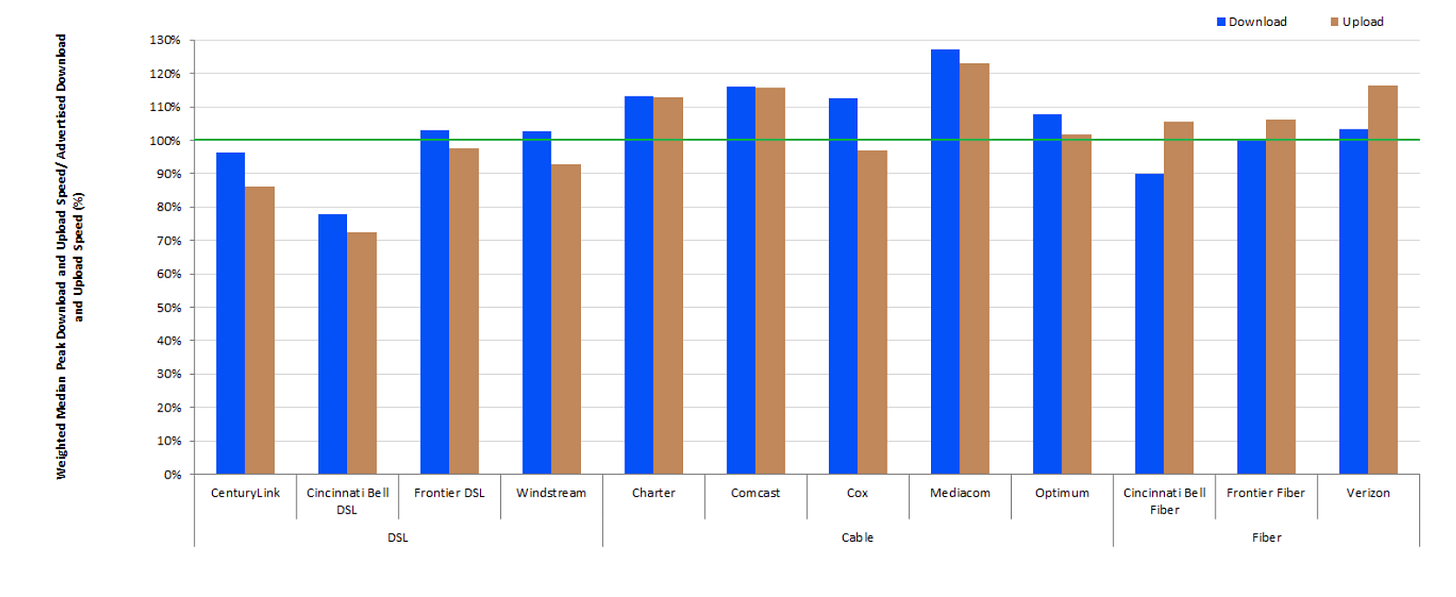
“Maximum advertised speed” is the throughput that the provider tells the FCC they can offer to the location. The FCC publishes an excellent report called Measuring Broadband America which analyzes whether providers are delivering the throughput that they advertise. It finds that cable and fiber providers generally provide the throughput advertised but DSL service can be as low as 72% of the advertised throughput. Unfortunately, the MBA report has a small sample size and doesn’t have a category for fixed wireless (FWA) providers.
I want to look at what the impact is of offerings where the subscriber might not get the advertised throughput.
One place to look is in fixed wireless offerings. FWA coverage can be difficult in hilly terrain, or when foliage obstructs the signal’s path to the home. There have been technical advances in FWA radios that improve throughputs in non-line-of-site situations. Still, signal loss is real.
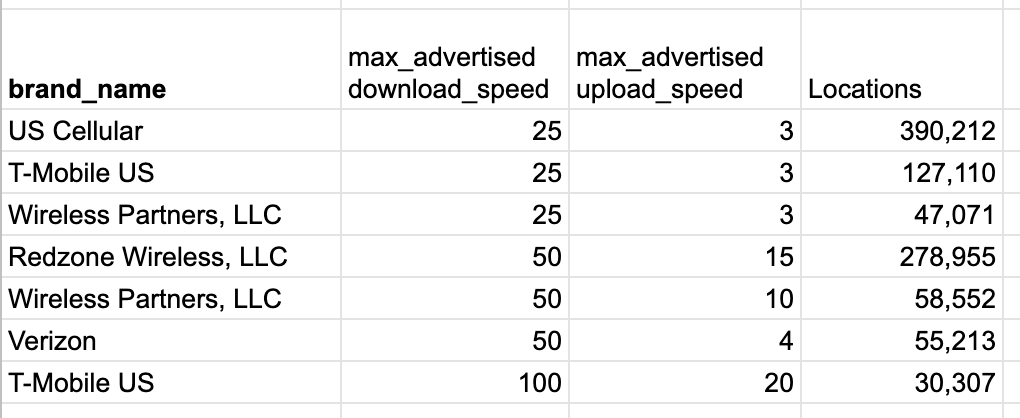
US Cellular offers a FWA home broadband product. According to the FCC maps, they offer 25/3 service to 390,212 locations in Maine. I went through the US Cellular sign up process. Nowhere do they advertise throughputs of 25 down and 3 up. In fact, in the FAQ about throughput they link to a document that says Portland, Maine has 75th percentile throughput of 18.8 Mbps (the median would be lower).
What happens if the US Cellular offering were not considered acceptable home broadband (which it isn’t)? Without US Cellular’s offering, Maine would have 53,217 unserved locations, an increase of 21,156 locations from the 32,061 that are unserved according to the BEAD formula. At $4,100 per unserved location for the BEAD allocation, that’s more than $86 million in funding. As importantly, this is 21,156 locations (mostly homes) that are technically “underserved” and under a strict reading of the IIJA, Maine would need to give precedence to locations that are unserved.
US Cellular is claiming coverage of 390,212 locations but when they are excluded, the unserved number only goes up by 21,156 because other providers may offer 25/3 service to the location, in some cases another FWA provider. Another FWA provider in Maine, Redzone Wireless, offers 50/15 service to 278,955 locations. By contrast with US Cellular, Redzone’s website has a realistic looking coverage map, and they advertise “up to 50 Mbps” on the website. (This is probably a good time to mention that I have a lot of respect for the FWA providers I’ve interacted with. I generally find them to be entrepreneurial, creative technologists who are passionate about delivering connectivity to their subscribers.)
The FCC clearly knew that FWA coverage areas could be problematic. When the previous FCC adopted the “Second Report and Order” for rules around the Broadband Data Collect, paragraph 12 states:
In particular, we require providers to submit an explanation of the methodology or combination of methodologies used and how they implemented those methodologies, including the distances from aggregation points, to the extent relevant. We will make such information publicly available, subject to individual requests for confidential treatment of this information.
It’s not so easy to put a wireless propagation model into written form. In many cases, what was submitted it not helpful in understanding what the real coverage of FWA would be. US Cellular, whose submission is lengthy compared to others I read, provided:
Using BDC guidelines, a link budget is created for the required throughput with receiver at 5m height. This link budget is used in Atoll planning tool to generate a coverage polygon. The coverage polygon is corrected using geometric checks and then is laid over the location fabric data to select the location IDs and assigned the throughput on uplink and downlink for each technology as per the availability data submission requirement. The location fabric data generated is checked for duplicates and other discrepancies before uploading to the portal.
It’s a lot of words, but what it doesn’t have is the actual link budget — how much does signal degrade further away from towers, and how are they calculating signal loss due to obstructions.
At the national level, if we consider an offering of exactly 25/3 from FWA or DSL to be unserved instead of underserved, we would add 2,043,676 unserved locations to the national map. Some states have a lot of them. North Carolina has 193,049 locations that would be unserved if the 25/3 FWA/DSL offering were excluded.
Here’s a random location in Bartlesville, Oklahoma. This location has access to a 40/10 unlicensed FWA offering and Starlink, neither of which count as reliable broadband according to the BEAD definition. They are considered "un[der]served” because of two 25/3 licensed fixed wireless offerings.
To be clear, I’m not sure that the provider can’t offer 25/3 service. In some locations, near DSL aggregation points and radio towers with good line-of-sight, they probably can. It still isn’t usable home Internet.
It’s unclear to me if there’s anything that can be done about this issue (or even if others agree it is an issue). The FCC has set a high bar for “availability challenges” — challenges to what the provider offers at a location. It’s an unpopular opinion, but it’s understandable, in my view, that the FCC wouldn’t use “speed test” data from random phones and laptops on Wifi as concrete evidence that the advertised service isn’t delivered to the router. What then is the path to validate the “maximum advertised speed” claims made by providers in the data? It’s unclear to me.
I hope something can be figured out for these locations. 25/3 DSL or fixed wireless isn’t good enough if we’re really trying to connect everyone in the country.


It's funny because for months (years?) my colleagues at PAgCASA have spoken about using hardware devices to complement the browser based speed tests.
We always thought that the FCC and ISPs would challenge the tests, because that's been the previous history.
I thought it was mighty bold of so many businesses to do broadband mapping via browser tests with the understanding that the data would be submissible.
That felt like just whistling past the graveyard and ignoring the part of the business model that they did not want to see.
What's the solution? Verify the maps with hardware instruments that are beyond scrutiny of the FCC/ISPs. Human error is tied inextricably with browser tests - they are good for understanding where a problem is, but the final numbers should come from instruments that eliminate the errors in having humans doing browser tests.
Excellent article as always. Now my 2 cents.
The FCC disallowing speed tests is not logical or practical. This applies regardless of the provider "source".
At a more simple logical level, If you cant measure you cant manage. What is the metric if speed tests are not the measure? The current "service" model doesn't make any sense.
It is similar to saying a speedometer isnt accurate because the tire size may vary, and the speedomter isnt 100% accurate. Without an independent measure we cant know what service level actually is.
Treating speed tests with a grain of salt is totally acceptable. We look at samples and if we see a mix of "served" "underserved" and "unserved" (by our definition) we can be sure services are available because some is visible - and there are always variables.
Perhaps they require 10% or even 20% sample rates? Or multiple samples at different times of day and days of week? All providing statistically supportable empirical evidence.
In Brown County WI if we see areas where every single test is well below 25mbps (in some cases below 5mbs) that leads to the conclusion that that area is UNSERVED by our definition and 99% chance it is actually unserved by the IIJA definition. https://browncounty.maps.arcgis.com/apps/webappviewer/index.html?id=ae44a0c299554f7ea4e2561d82700451
With a 10%+ sample size I believe Brown County can prove that service in specific areas is well below the 25/3 advertised threshold (if we are allowed). We also identify where we need more samples to be sure we are exceeding 10% sample rates. Being rigorous for Speed Tests is good, but denying speed tests leaves a hole.
Thoughts?