(Update: As of Monday May 22, the Funding Map was updated to reflect 3.46 million locations funded by RDOF which seems much better)
One requirement of the $42 billion dollar BEAD broadband deployment program is funding not be allocated where another federal program already provides an “enforceable commitment” to build broadband. Everyone — Senator Thune is especially outspoken on it — wants to see the broadband money well-coordinated across all the federal agencies involved, including Commerce, Treasury, FCC, and USDA, to name the big ones. To facilitate this coordination, Congress included Section 60105 in the Infrastructure Bill, instructing the FCC to:
Not later than 18 months after the date of enactment of
this Act, the Commission shall, in consultation with all relevant
Federal agencies, establish an online mapping tool to provide a
locations overview of the overall geographic footprint of each broadband
infrastructure deployment project funded by the Federal Government.
The FCC’s “Funding Map” was just published, on the day of their deadline, and at first glance it needs work. The FCC’s own Rural Digital Opportunity Fund originally had winning bids for 5.2 million locations. As of the latest release of authorized winners, 3.5 million locations were moving forward. But according to the FCC’s funding map, 11.3 million locations will get RDOF service. This is not good. There is no possible way RDOF will bring broadband service to 11.3 million locations.
Here’s one issue: Conexon was one of the big winners in RDOF. According the latest official release, they’ve been authorized for funding in 10 states. In Louisiana, they’re authorized for 51,589 locations. But on the FCC Funding Map, the Conexon record for Louisiana shows they’re authorized for 515,890 locations, exactly 10 times the real number. In fact, all of the Conexon records on the funding map are exactly 10 times their actual number of locations according the FCC’s RDOF results. (All the funding awards in RDOF are reported at a yearly level. To get the 10-year total funding, you multiple the award amount by 10. But that multiplier shouldn’t be applied to the locations, if that’s what happened.)
That doesn’t explain all the difference in these numbers. Another big RDOF winner was AMG Technology Investment Group. According the official RDOF-authorized totals, they won 205,722 locations, including 36,167 in Iowa. But according to the Funding Map, they won 506,338 locations in Iowa.
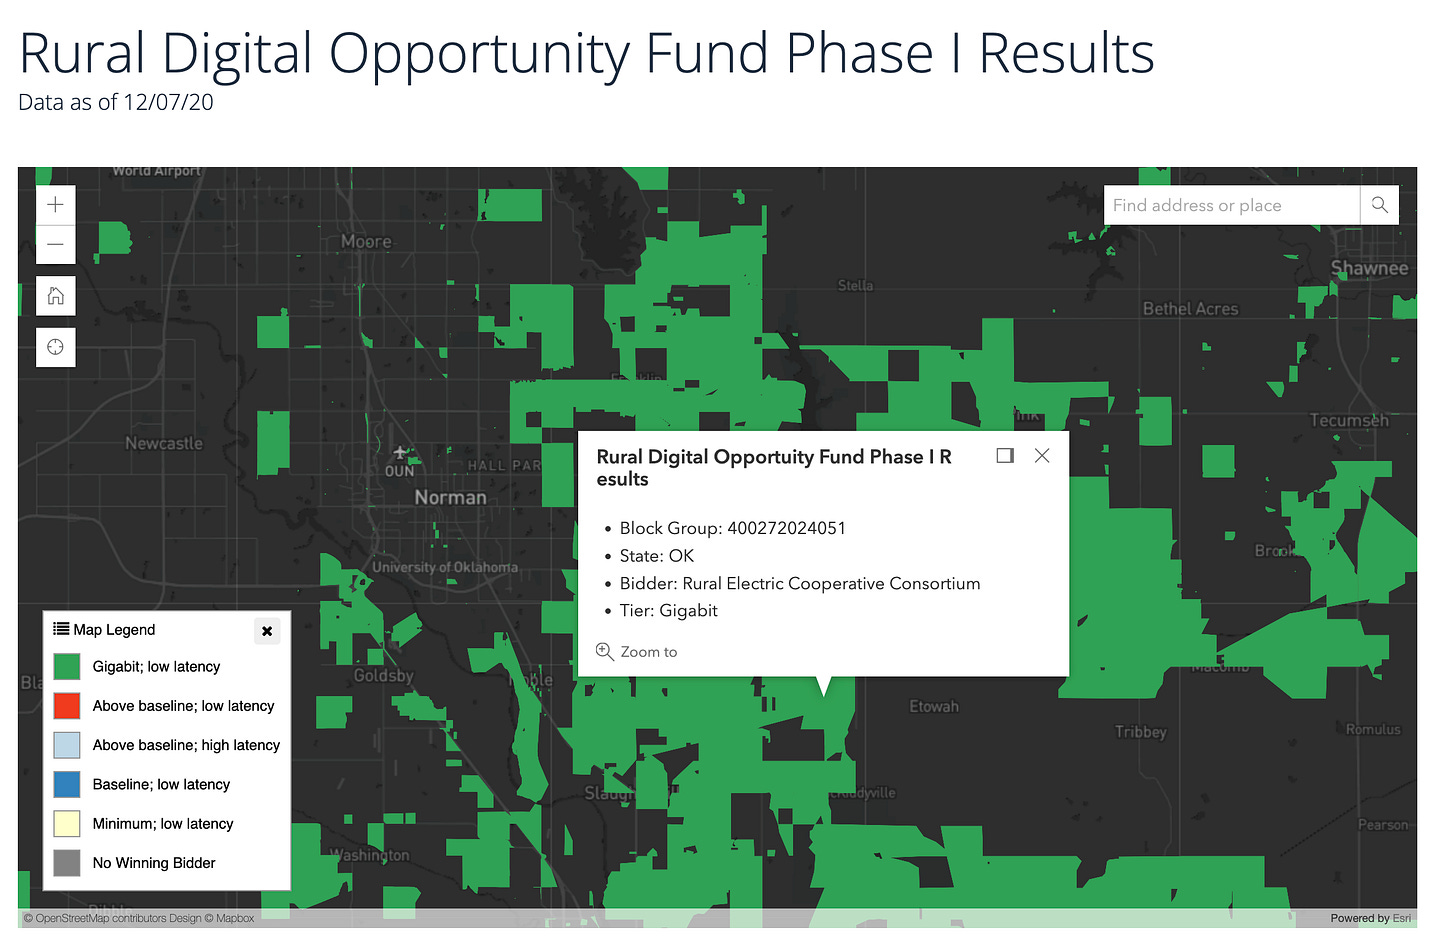
Another possible explanation is the geographies used. Only certain pre-defined Census blocks were eligible in the RDOF auction, but the bidding happened at the Census block group level — one level higher in aggregation. The smallest unit that could be won was a block group, and the winner would be responsible for all the eligible blocks in that block group. It’s possible this map mistakingly aggregates all the locations in the eligible block group. By my count there are 16 million housing units according to 2019 housing unit projections in Census block groups that have been authorized for RDOF.
There are a few ways the number of locations could have changed since the RDOF reverse auction. RDOF was based on the 2010 Census, and the geographies have changed for the 2020 Census. Also, the Broadband Serviceable Location Fabric has lots of rural farmhouses and other make-believe locations that could be counted in this map. But the gap is too big. 3.5 million authorized locations now represented as 11.3 million locations suggests a deeper data problem.
Data issues happen. I’ve certainly committed my share. But RDOF is the easiest of the broadband programs to incorporate into a map like this. It’s run by the FCC, it’s relatively recent, and the rules (and data) around which areas were won and authorized in the auction is publicly available. Problems with RDOF mean there will be worse problems with USDA’s Reconnect program and the American Rescue Plan Act funds overseen by Treasury, but granted at the state level.
I’ve tried to find areas and locations funded by state-level ARPA programs. Despite ARPA committing, by my count, almost $5 billion for new or upgraded broadband service covering 1.3 million locations across 35 states, I could only find online maps showing the coverage areas for two: Minnesota and Louisiana. Here’s an example of what the real world of non-standardized broadband data looks like. In Duluth, Minnesota, the state received three applications to bring service to the community. One provider submitted a layer of dots representing the locations they would cover (green). Another submitted a layer of street segments they would cover (yellow). And a third submitted a larger area polygon (purple).
The state then published a layer representing the areas that were still eligible for funding, which appears to be a subtraction of all the three application layers. It is very hard with non-standardized data to say authoritatively which locations have an enforceable commitment for broadband service, and which do not. And these are the states that actually have readily available data. If a state doesn’t publish its ARPA awards data, it’s entirely possible the data is even more messy.
We’re overdue for a database that tracks broadband funding over time and location. This — at least right now — isn’t it.


See Maine’s ARPA awards and integrated data via public viewer here. https://experience.arcgis.com/experience/d69e1e96cc5b44e0bcb8691b96a3e24c/