The weird cable coverage submission in Arkansas
If you zoom into Pine Bluff, Arkansas on the FCC map, it doesn’t take long to realize something doesn’t look right. While the new maps show broadband service at individual locations, we’d still generally expect an ISP that serves one location to serve the location next door, up to the edge of their network. This map doesn’t look right.
The green Served dots on this map are Pine Bluff Cable TV, part of WEHCO Video, Inc, a cable provider offering 250 download, 20 upload throughput in Pine Bluff. All the green dots on this map have the cable offering; all the red ones don’t. That means all of these red dots will be included in the NTIA’s allocation to Arkansas for Unserved locations.
The problem isn’t limited to Pine Bluff. In all of WEHCO’s service territory (they have different d/b/a’s in each city), the same pattern is visible. A couple things could have happened. Maybe WEHCO uploaded their subscriber list instead of their coverage area. Maybe someone opened the file in Excel one last time before submitting and it cut off random rows at the end. Maybe they did a particularly haphazard match between their coverage area addresses and the FCC’s Fabric addresses.
My understanding is that the FCC is aware of this issue. I assume it will be corrected in the next version of the National Broadband Map, but it will be easy enough to confirm. Thankfully, I think this is the biggest of these issues; I could only find one other smaller issue.
The table below counts the number of blocks a cable provider offers service in. Then it adds up all the locations in those blocks and compares it to the number of locations the provider actually offers service to according to the FCC data. There’s also a column for what percentage of the service area is Unserved, which is important if we’re concerned about this issue affecting allocations.
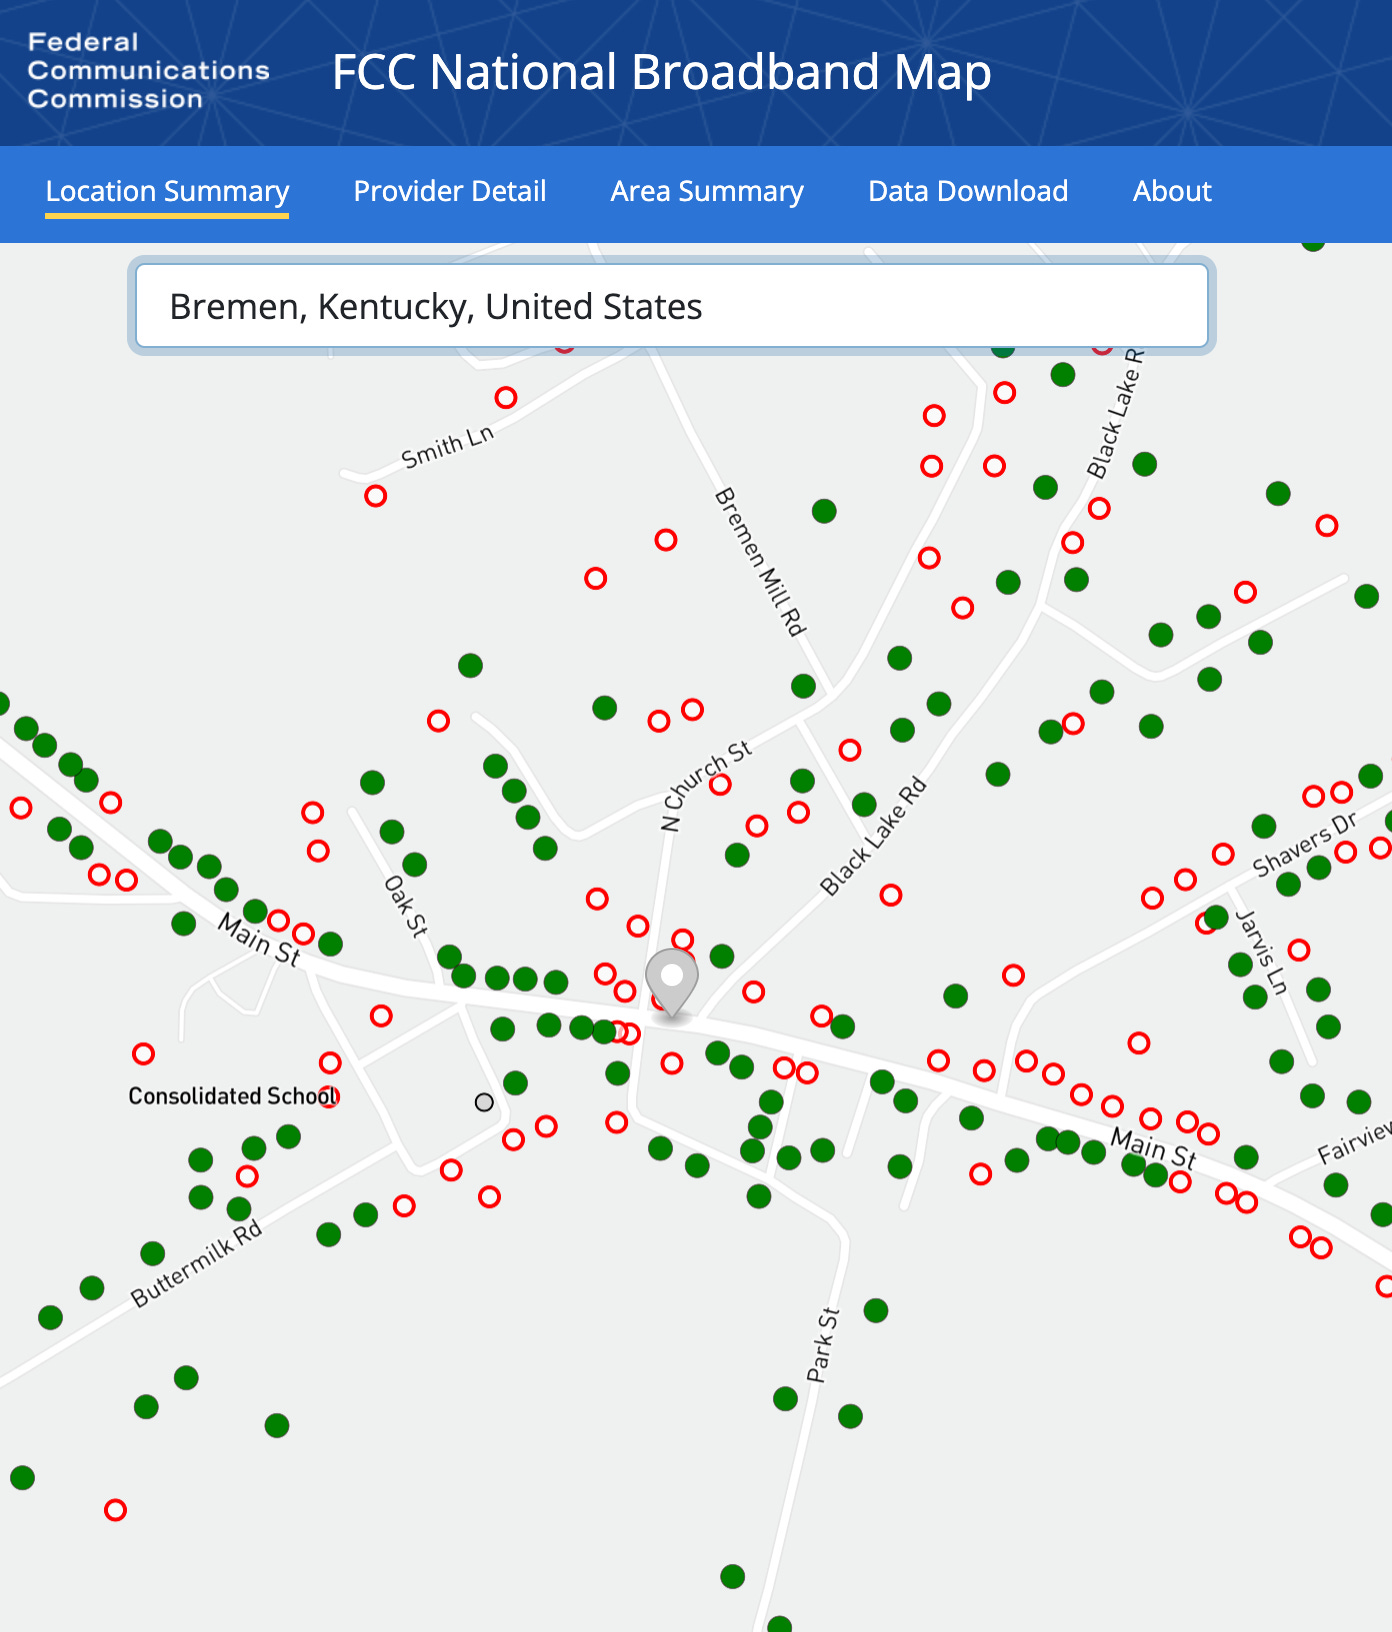
The WEHCO companies are all over the list. The only other one I found that looks weird is Broadlinc (d/b/a White Cloud Communications) in Kentucky.
Overall, I view this as evidence of a process that is working. This was very likely an error in the first submission the provider made under the new process. Hopefully it is corrected next time. However, it does highlight that there is less attention and incentives to fix certain types of errors in the map. While every new Unserved location is worth more than $4,000 to the state, extra Unserved locations in one state is hurting every other state a tiny bit. It isn’t clear who is incentivized or responsible for cleaning up errors that are producing too many Unserved locations.


Broadlinc here - Round 2 will definitely be different for us. Doing this stuff in house is a pain. Did it the hard way 1st round by trying to match addresses. Learned some basic stuff in QGIS and was able to get our reports spot on this time around!