First look: New version of the National Broadband Map
This version will be used for allocating funds in the NTIA's BEAD program
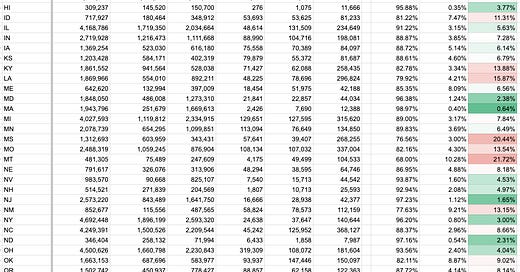
The FCC released an updated National Broadband Map today and I’m ready to share the first version of a state-level analysis. This is the version of the map that will be used by the NTIA to allocate $42.5 billion in the Broadband Equity, Access, and Deployment (BEAD) program. I’ll provide the top lines here and more detailed methodology and caveats are below. Overall, as of December 31, 2022, there are 114,538,393 Broadband Serviceable Locations (BSLs) in the country (including territories). That’s a net addition of 1 million BSLs. 7.3% of the BSLs are Unserved, which is 8.26 million, up 462,066 in the 50 states. 3.19% of the BSLs are Underserved, or 3.62 million nationally.
Here’s the spreadsheet.
There are some surprises. Michigan, for example, lost 83,568 Unserved locations, an 21% decline, which leads to a $412 million lower allocation. (This deserves further investigation). North Dakota, Indiana, Florida, Georgia, and South Dakota also have double digit loses in the percentage of Unserved. (Lower Unserved numbers mean the maps show more locations as Served or Underserved, which lowers the allocation to the state).
In some states, the addition of Unserved locations is dramatic. Alaska’s Unserved locations grew 84% to 88,181 increasing their allocation by $185 million. There were a lot of other states with big increases: Nebraska (+222%), Iowa (+117%), Oregon (+65%), Kansas (+46%), and North Carolina (+45%).
(All of my comparisons to the previous National Broadband Map v1 are from the original data released by the FCC last November, with the exception of Illinois and Hawaii, which were updated. My understanding is, other than Illinois and Hawaii, the corrections to the v1 National Map have been minor.)
The big news is the projected allocation of the $42.5 billion. NTIA plans to release the allocations at the end of June, so it is more than likely that with the release of this data, the allocation levels are now set.
Ten percent of the overall allocation is based on the number of “high cost locations” in each state. To my knowledge, NTIA still hasn’t published how they plan to determine how many high cost locations each state has. As an estimate, I use numbers I generated in previous analysis that are themselves based on the reserve prices from the FCC’s RDOF reverse auction.
These allocation estimates include the territories, since that is how the allocation will be done by NTIA. However this allocation could undercount Unserved locations in the territories since the broadband coverage options are fewer. For example, in the previous release I had Puerto Rico with 213,000 Unserved out of 1.16 million BSLs. In this version, I get 62,036 Unserved out of 1.15 million BSLs. That leads to a minus $628 million swing for Puerto Rico (money that goes to other states). If the FCC releases authoritative numbers of BSLs and housing units in each Census block I’ll update these numbers.
If there are updates/changes/corrections to these numbers, I’ll post them as updates to this page or new posts.
I will have much more analysis on what’s changed since the first fabric release, and what this means for where things stand on broadband deployment in the future.
If you wish to cite this numbers, please do so as “estimates from broadband analyst Mike Conlow” and link to this Substack post. As always, if you want to reach me you can respond to the Substack emails and it will get to me.
(Update 6/6/23: I updated the numbers in this post to reflect the correction made of adding in Licensed by Rule wireless, as discussed here.)


Kudos- that was quick work! A clarifying question related to the technologies used to determine coverage. I assume you are following NTIA's lead, but if you could clarify how various technologies are handled with your analysis (particularly wireless), I'd appreciate it.
Interesting info. Thanks for the detailed analysis you do. I know in Georgia, where I live, the Governor has used a lot of the funds available from the American Rescue Plan Act (ARPA) for broadband projects, both from the State and Local Fiscal Recovery Funds (SLFRS) portion of ARPA, and the Capital Projects Fund (CPF). For example, in February of last year Georgia announced $408 Million in grants from ARPA (SLFRS). With matching funds from the grantees that number goes up to $738 Million. It's estimated those funds will cover over 132,000 locations, and those locations may not have been flagged in the first Fabric as committed Federal funds, in which case they would have shown up as Unserved in the initial map. In February of this year Georgia announced another $234 Million in grants from the CPF, which will add up to $455 million total with matching funds from grantees. Those funds will cover another 76,000 locations. So, that's over a billion dollars that will be put to work to deploy broadband to over 200,000 unserved locations, before any BEAD awards are made.