Using a project-building algorithm to estimate areas that are likely to get fiber BEAD applications

For months, myself and others have made projections about how far the broadband money could go if it were allocated relatively efficiently across all the unserved and underserved locations. With a shrinking unserved location map due to new builds and other funding programs, things have generally been looking good.
However, as I've discussed previously, "relatively efficient" awards only result when there is at least some competition between competing applications. That's why the BEAD rules emphasize that states "must establish fair, open, and competitive processes for selecting subgrantees" -- NTIA knows that the key to making BEAD funds go as far as possible is to promote competition between providers for grants. Therefore, while it has been useful for planning purposes to have a view of how costs vary across eligible locations, the far more important question going forward is not costs in the abstract but rather whether most states will receive competing project proposals from a range of providers. And that is a very different question from cost modeling, as I'll explain below.
So today I’m going to come at this from a new perspective, and discuss an algorithm I built that automatically builds projects areas from a provider’s perspective, and the implications for grant rules and providers as they think about where to apply for funding. I’m using 100% public data and chose Iowa as my example.
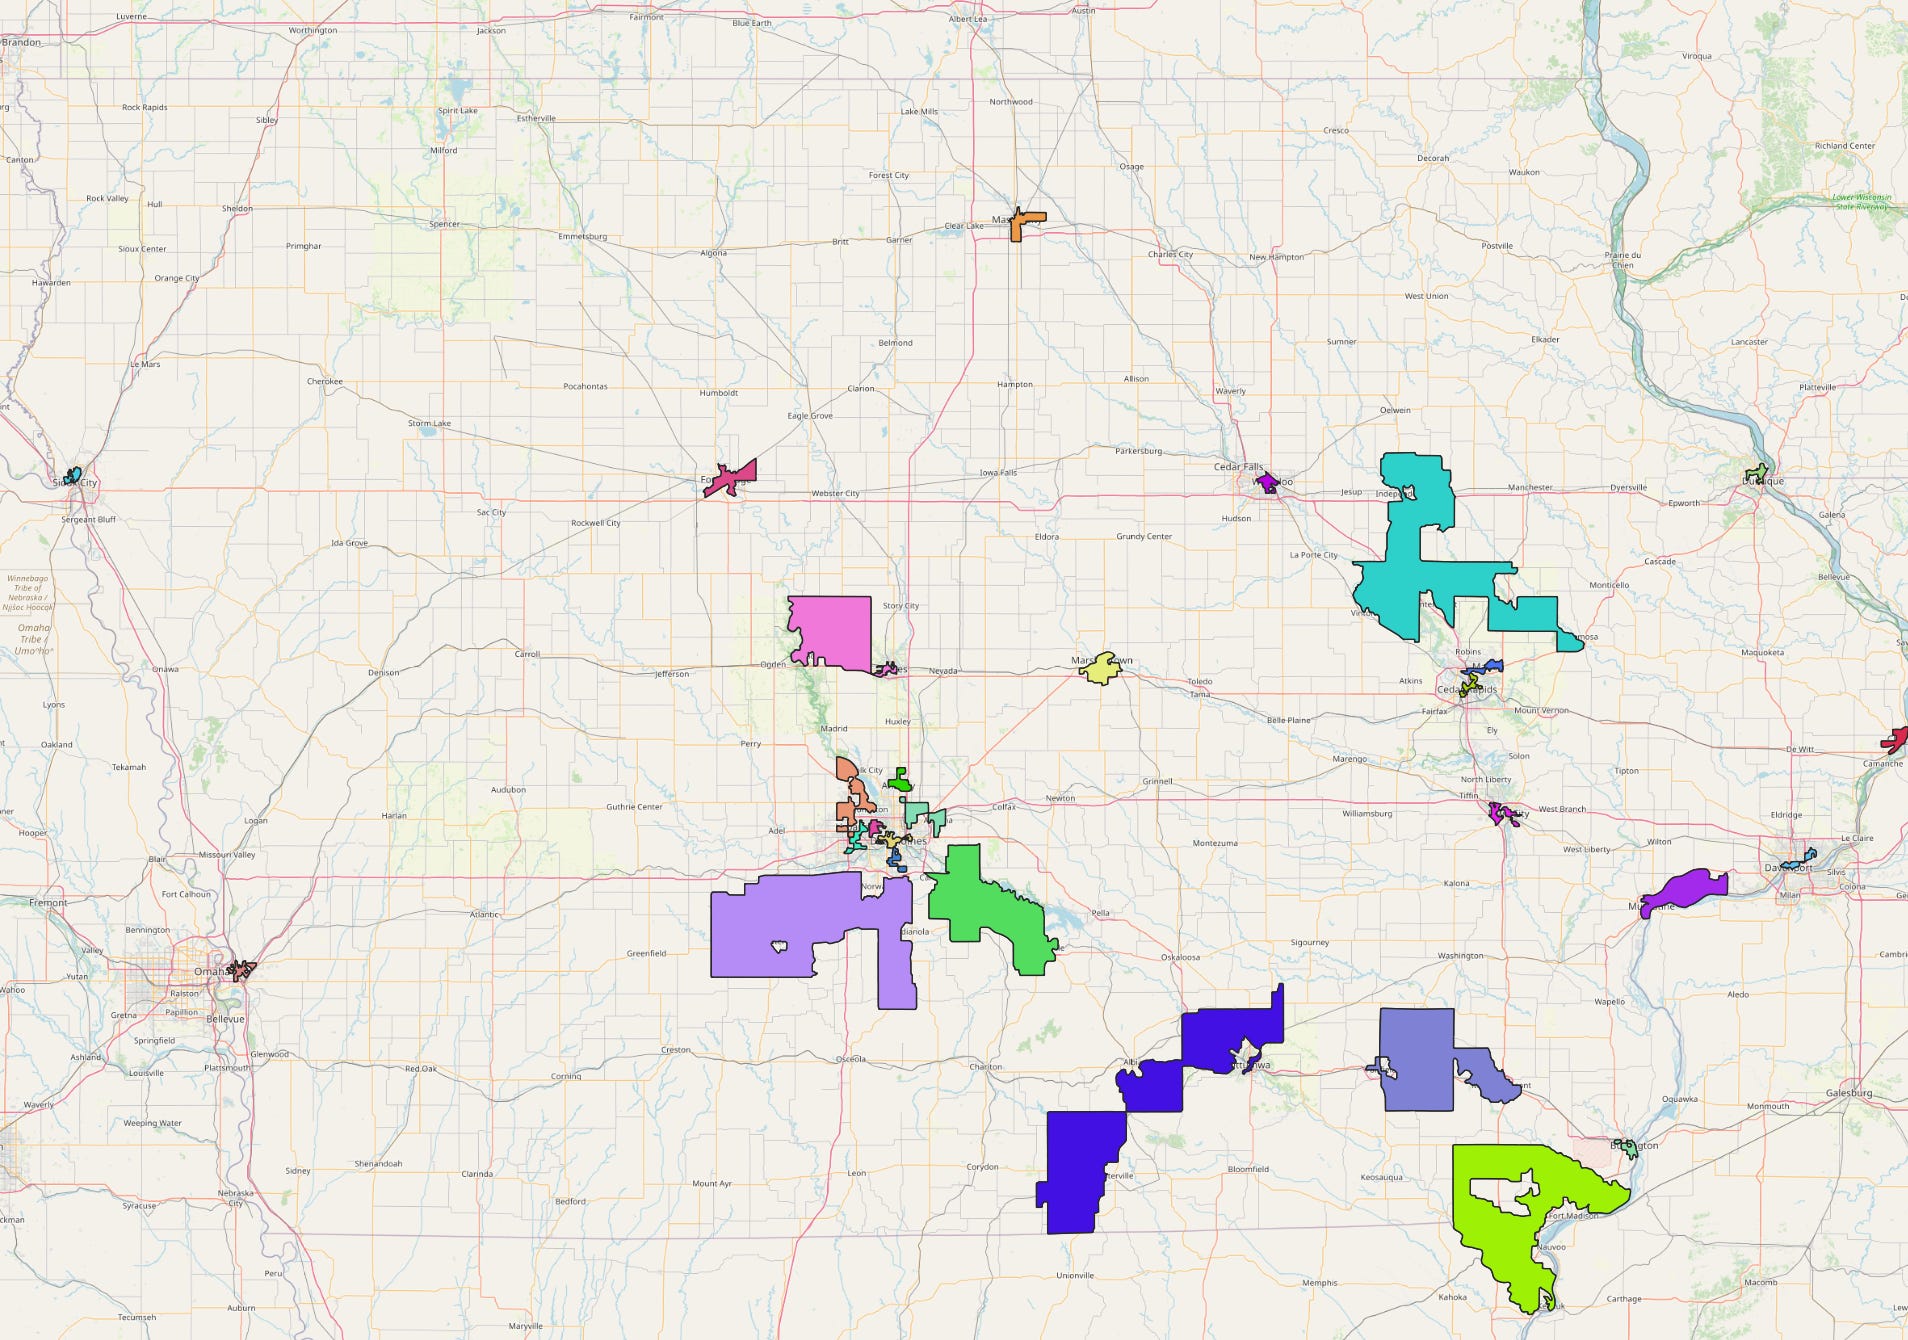
Diving right in, here are the project areas that I created in Iowa. In this example, I use Census block groups as the smallest unit of geography, and I find only 25 projects that look viable, covering only about 10% of the unserved and underserved locations. These span the range of urban projects in Des Moines to rural projects outside Des Moines and other places.

My takeaway from this first map is that a greenfield fiber overbuilder is going to look at most of Iowa and have three words: “no thank you!”. Providers are thinking about the return on their investment, not just how many unserved and underserved locations they will have access to. And Iowa is expensive.
Even turning up the amount of BEAD funding that’s available, the algorithm still only finds 28 projects that cover a combined ~20% of the BEAD-eligible locations with fiber.
If overbuilders aren’t interested, there’s still a chance a local RDOF winner or other provider is interested in filling out their network. These local players will have different economics than the greenfield overbuilder I’m modeling here. But without the credible possibility of lots of applications in their area, the local network may be able to set the terms of the BEAD award.
Here’s an example. Southwest of Garner, Iowa is a census block group that is mostly served by fiber from Communications 1 Network. Nine percent of the CBG is underserved currently, but was mostly won by Nextlink in RDOF. That leaves 15 of the 992 BSLs as BEAD-eligible, according to my estimates. It’s not surprising that my algorithm doesn’t find this interesting from the overbuilder perspective. It’s possible that Communications 1 Network will bid for this area in BEAD; but most likely Nextlink will be the only application.

There are some similar questions that I think this type of analysis can likely shed light on as well.
What does this say about the amount of BEAD funding that will be needed to be available to attract fiber providers to high cost areas?
We know that there are locations — hundreds of thousands nationally — that are served by cellular licensed fixed wireless and not eligible for BEAD funding. What is the impact of those areas on the viability of an entire project area? Doug Dawson did a great piece on this recently.

As the final BEAD maps come into focus, we’re leaving the “write a report based on a hypothetical efficiently implemented cost model” period and entering a new phase of “what will providers actually propose for FTTH projects”. It doesn’t change the fact that low cost states have plenty of BEAD dollars available to attract providers. But it does highlight the fact that high-cost states, which were already likely to come up short, may have trouble attracting the kind of competition that’s necessary to keep costs down. $42 billion is a lot of money, and the policy assumption has been that lots of FTTH providers will want to compete for these funds in most areas. But if the project-level economics don't work, that assumption may prove incorrect.
A couple end notes: This analysis is absolutely laden with assumptions. The biggest assumption of all is the cost to build fiber to a group of locations. Unlike some eastern states, Iowa is almost certain to run out of BEAD money before they can bring fiber to all their unserved and underserved. Their allocation from NTIA was $415 million. Using my cost model, they need about $1.1 billion to reach all their locations with fiber.

As I’ve done previously, I use the reserve prices from the FCC’s RDOF auction. This gave a view of what the FCC thought it cost to build broadband to different census block groups at the time of the auction. As I’ve also done previously, I multiply those estimates by 1.35 to capture inflation and supply chains and everything else. In Iowa, there were 1,295 eligible CBGs for RDOF. They follow a familiar curve for broadband cost models:

Next I need to fill in the gaps for block groups that weren’t eligible for RDOF, and I need to translate the 2010 block groups to 2020 block groups since all the new data is done against the 2020 census. For this I feed the data into a machine learning algorithm. I start with the pock-marked map on the left, and wind up with the map on the right, which now covers the whole state. When you look closer, those less expensive block groups in the middle of rural areas are generally the county seat, the biggest city in the county where there’s a little bit of density.

Another assumption is what unit of geography is the smallest available. Changing the smallest unit of geography by itself makes a big difference. When zip codes are used as the smallest unit of geography, suddenly we’re down to 16 viable projects.

Now that the map of what will be BEAD-eligible is starting to come into focus, we can model what might happen in the actual BEAD process, subject to lots of assumptions. Any one of the assumptions is going to have a big difference in the outcome, from both the providers’ perspective and the state.