We need better data to truly unlock technological neutrality in broadband deployment
Every year by law the FCC has to “determine whether advanced telecommunications capability is being deployed to all Americans in a reasonable and timely fashion.” If not, the FCC “shall take immediate action to accelerate deployment of such capability by removing barriers to infrastructure investment and by promoting competition in the telecommunications market.” It’s the so-called “Section 706” report, and the FCC is currently accepting comments about it. While broadband data is in better shape with the new BDC maps, there are critical gaps that mean we don’t have enough data to fully answer the question.
First, the FCC’s broadband deployment maps ask ISPs to submit their maximum advertised speed. Why are we asking for advertised speed when we want to know the expected speed? This seems like an easy fix: the FCC should require ISPs to submit the speed a customer should expect during peak periods of usage. (Doug Dawson has written repeatedly about this) We can deal with enforcement separately, but my advice is to fix the issues we know exist.
When advertised and expected speeds differ, it could have a big impact on whether we consider a location to have adequate broadband. Consider the below chart. Cable and fiber offerings are almost all served according to their advertised speed — 98% or more of cable and fiber’s footprint have advertised throughput of 100/20 or better. But DSL and fixed wireless both straddle the all-important thresholds at 25/3 and 100/20.
This means even small differences between advertised and expected speeds could move a location between served, underserved, and unserved. Some states, conscious of this issue, are proposing in their BEAD plans to treat fixed wireless (or portions of fixed wireless) as unserved for the purposes of BEAD. From the North Carolina volume I BEAD proposal:
The division will treat locations that the National Broadband Map shows to have available qualifying broadband service (i.e., a location that is “served”) delivered via licensed fixed wireless over network primarily built for mobile connectivity as “unserved.”
I believe Ohio is proposing a similar approach, though all the links to their plans are not working at the moment. Unfortunately, we don’t have great data on the difference between advertised and expected speeds, but we do have some.
The Measuring Broadband America report is a important set of data about actual broadband speeds in the U.S. As part of this report, the FCC sends “white box” hardware to 12,000 subscribers. Those boxes take speed measurements but also measure latency, web page loads, and lots of other important metrics.
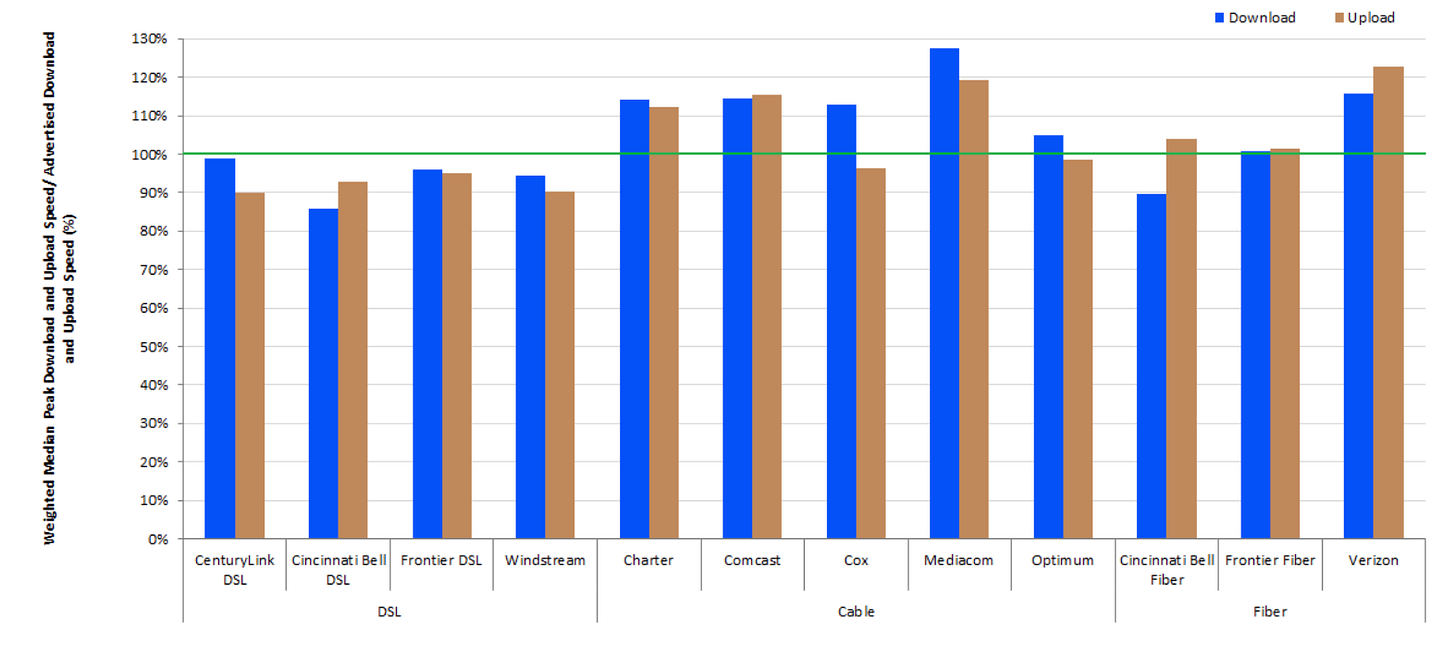
The most important chart on this topic might be the one below, where the FCC reports on the speed delivered by an ISP versus what the subscriber is paying for. It shows that with rare exceptions, cable and fiber ISPs deliver the speed that they promise. On the other hand, DSL ISPs deliver about 85% of the speed they promise.
It is critical that this program is dramatically expanded. We need this same data for other technologies like fixed wireless. And we need enough sample size that we can determine what combinations of spectrum, radio equipment, and subscriber-tower locations leads to delivery of the expected speeds.
Perhaps anticipating questions about whether the advertised speeds of fixed wireless ISPs would match the expected speeds, the FCC required certain additional details to be submitted with their BDC filings. From the Third Report and Order:
A plain language reading of this suggests the FCC wants details about fixed wireless filings to assess their accuracy. Seems like a great idea. But my best understanding is, if you read this carefully, there’s a loophole here: if a provider submits their coverage filing as a list of locations, they only have to submit the most basic of information. Only if they file their coverage as a “propagation map” do they have to submit details about the propagation model.
Here’s one such methodology filing:
Redzone’s BDC coverage was determined through detailed radio frequency propagation studies, and by GIS professionals who determined coverage at the latitude and longitude coordinates (not the addresses) of the locations provided in the BDC fabric data by using the propagation maps generated from those studies.
Not exactly enough information to make a useful determination of how accurate the filing is.
Back to the Measuring Broadband America report, which could and should serve as a baseline: what is the actual broadband performance of subscribers across a broad sample of households? Unfortunately, it seems the MBA program is, if anything, in retreat. Currently, there’s a nastygram at the top of all MBA pages suggesting the FCC broke up with SamKnows (who was acquired by Cisco around this time) and suggesting participants turn off their white box device, and that the FCC will continue the program “internally”.
Let’s look at the difference these technologies make in the final National Broadband Map. I’m making the case that cable and fiber deliver the speeds they promise. And I’m making the case that I don’t know whether other technologies deliver the speeds they promise. In that way, we know the best case (that all technologies deliver the speeds they promise) and the worst case (that only fiber and cable do).
The most interesting are the locations that are unserved by cable and fiber, but served by another technology. Put another way, this chart highlights fixed wireless (or DSL) ISPs advertising speeds of 100/20 or greater, where no cable or fiber option reaches the home. Nationally, there are 3.6 million of these — that’s a lot.
Here’s a couple random examples of these locations. First is a set of locations in Canton, Texas, east of Dallas. Charter has fiber in the area, but there are dozens of locations only served by licensed and unlicensed fixed wireless. These fit both the FCC and NTIA definition of served. There is dense tree cover. Maybe fixed wireless can deliver 300/100 service? I’m not sure.
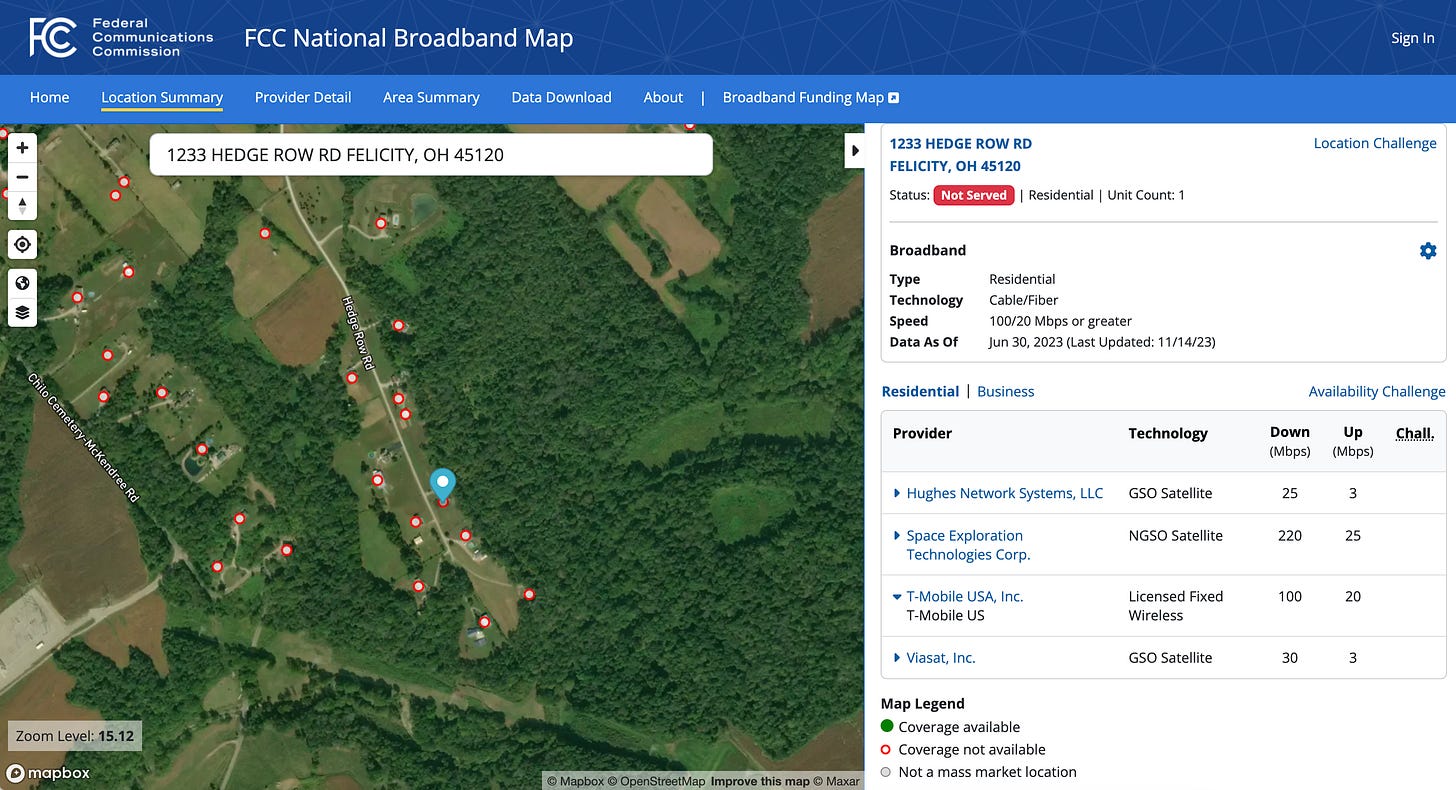
Here’s another in Felicity, Ohio. Charter has cable in the area, but large parts of the rural area don’t have a wired option. These locations are served by a 100/20 T-Mobile home Internet offering.
The last example is a location is served by a unlicensed fixed wireless provider at 100/60. (This is a case where the location would be BEAD-eligible because the WISP uses unlicensed spectrum, but would be considered served by the FCC because the FCC doesn’t consider spectrum bands in its definition). The WISP in this case has a very detailed coverage map on their website, and appears to have filed the same coverage with the FCC. That means most of the locations in this area would be considered unserved.
This may be selfish, but I’m worried we’re entering a broadband map multiverse. The FCC will have a definition of unserved, which even after this 706 proceeding could vary from NTIA’s definition of unserved and underserved (because the FCC would consider unlicensed fixed wireless on a equal basis with licensed fixed wireless). Then each state could have a different definition on unserved (or unserved) for the purposes of their state BEAD program, if the NTIA approves the proposals from North Carolina and Ohio (among others). Then, lastly, and maybe of most concern, is that each state is about to embark on their own challenge process. While these challenge processes will be based on the FCC map as a baseline, they could produce results that don’t feed back into the FCC map.
How accurate the fixed wireless and DSL coverage filings are makes a big difference in how we view the amount of broadband competition in the U.S. If we only count cable and fiber ISPs, 12.8% are unserved and 48% only have 1 ISP option (40% have 2+ offerings). Compare that against when fixed wireless and DSL are included and the picture is different: 59% of locations have access to 2 or more ISP offerings.
Let’s look at an example. Here’s a home in a subdivision in Stockton, California. They have access to Comcast cable and a bevy of fixed wireless options, including Verizon’s wireless home Internet at 300/20. I suspect that almost every home in this subdivision subscribes to the Comcast service and that very few use the fixed wireless options. I could show millions of other examples of this but they’re all very similar.
Much ink has been spilled recently about FW drawing subscribers from cable. I’m sure there’s some truth to that, and some competitive pressure. Though I still think there’s a difference between a location with 3+ ISPs where only one of them is cable/fiber versus a location with 3+ ISPs that are all cable/fiber.
My understanding is the FCC has data from the Form 477/BDC data collection process about how many subscribers each ISP has in a given Census tract. I don’t believe that data is made available, though I’m not sure it’s confidential either. That dataset could provide important insights into whether fixed wireless is providing meaningful competition to wired providers.
Close observers will know this whole post is about “technological neutrality” even if I haven’t used those words until now. Technology neutrality is the idea that state and federal subsidy programs need to set guidelines for the speed that they require of new broadband projects, but they should be agnostic to the technology ISPs use to reach those benchmarks. And of course that is right, but only if we actually know the performance of each technology choice. The 706 report tasks the FCC with “immediate action to accelerate [broadband] deployment” and this is what they can do: give us better data on the real-world performance of DSL and fixed wireless so we can be confidently technology neutral moving forward.


Mike,
Great observations.
One quibble. You assume in your Stockton, CA example "I suspect that almost every home in this subdivision subscribes to the Comcast service and that very few use the fixed wireless options." Absent supporting data, that is a questionable assumption. Nobody ever went broke overestimating the degree to which consumers hate their cable providers. On top of that, VZ and TMUS price their FWA plans much lower than the MSOs, especially with the mobile+fixed bundle. Anecdotally, a lot of people have at least tried out VZ and TMUS FWA service in hope that it might be a viable alternative. *If* VZ has good C-band coverage in the subdivision, it might have a higher share than you'd expect.